Christian Vega · Senior Data Analyst · Data & AI Engineer
I build data systems end to end.
Three of them are live.
I design, build and operate data systems end to end — the architecture, the pipelines, the application, and the operations that keep them running. Three of them are mine and in production: LicitaPR, StreetOS and Nidopr. Six years in regulated healthcare, payer and government data, currently as a Senior Data Analyst at Optum (UnitedHealth Group).
What I’ve led
Three live production systems.
Three systems running in production. I led each one from raw data to a working app to the ops that keep it alive, and I owned the judgment on whether it held up.
Nidopr
The Zillow-style data layer Puerto Rico never had. I took it from raw data to a live product, and it runs itself.
LicitaPR Inteligencia
Thirty-four government sources that don't talk to each other, unified into one procurement-intelligence product that looks ahead instead of back.
StreetOS
A multi-tenant operating system for food businesses: ordering, kitchen display, inventory, Puerto Rico sales tax by item class, and end-of-day close.
The proof, in numbers
What these systems do.
How I work
One accountable owner,
from raw data to a running product.
Six years across healthcare, payer and government data, and three production systems taken from the first crawl to live users. I design the architecture, build the pipelines and the models, ship the application and run the operations that keep it alive — and I hold every claim to a test before it ships. That is what a client gets from Vizlogic, and what I bring to a team.
Off the clock
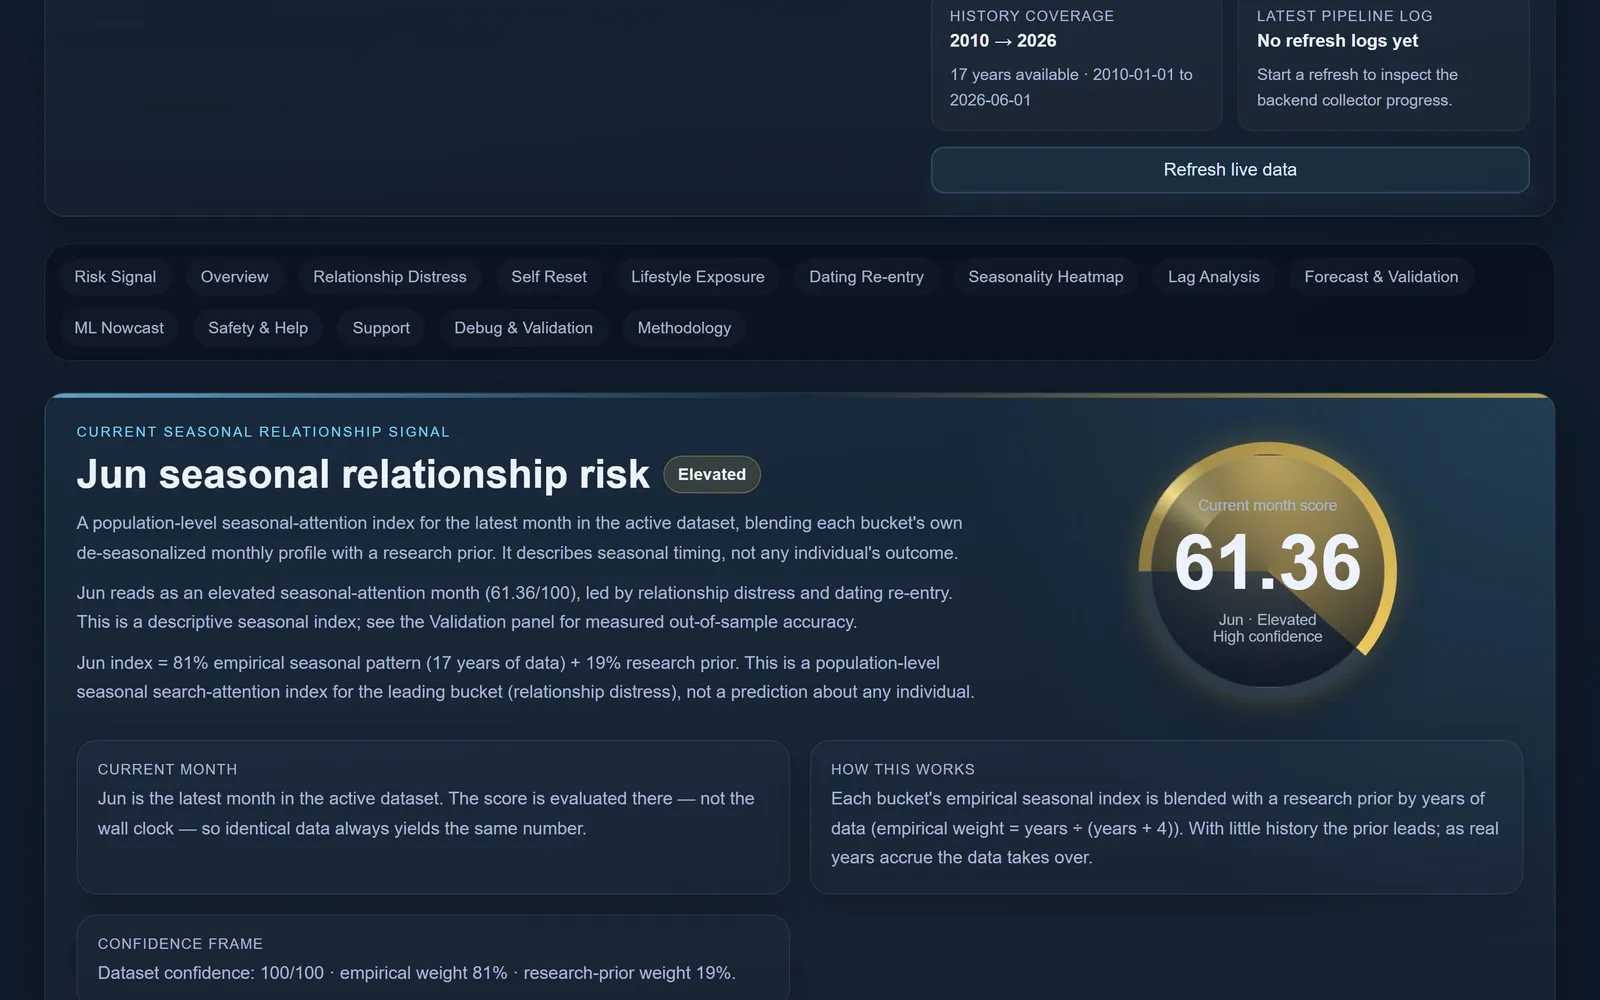
Can you see a breakup coming in the aggregate?
A question I couldn’t shake, chased down with 16 years of real US search data and hand-rolled statistics — then I spent most of the effort trying to prove my own answer wrong. It even cites the peer-reviewed paper that argues against its own thesis.
Have data? Let’s make it think.
Available for consulting engagements through Vizlogic, and open to senior data, analytics and AI engineering roles — remote, U.S.