What I’ve done

Selected work.

Three live production systems: a real-estate data marketplace, a government procurement-intelligence product, and a small-business operating system. Plus the observability and automation that keep them running. Each comes with a live preview or a walkthrough on request.

Pillar 1 · Live at nidopr.app

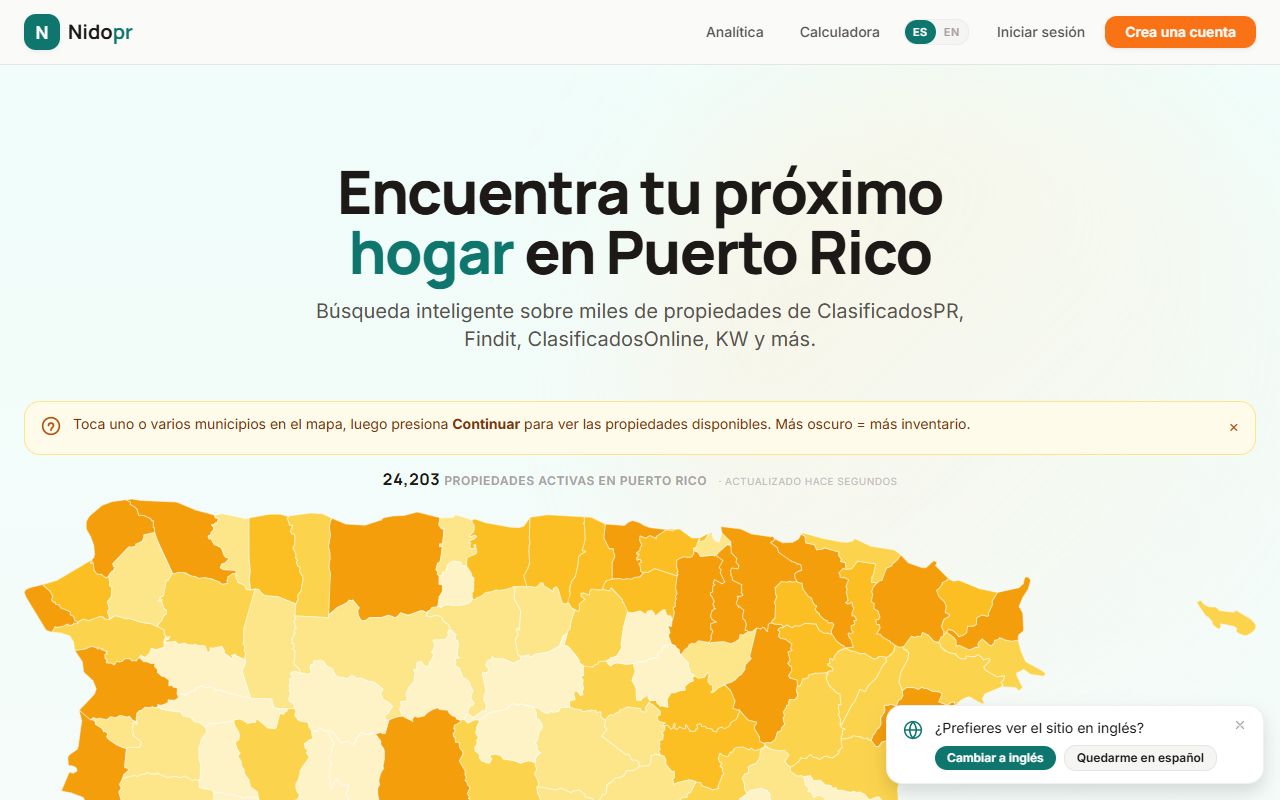
Nidopr

The Zillow-style data layer Puerto Rico never had. I took it from raw data to a live product, and it runs itself.

~64,000listings aggregated & served (10+ sources, nightly)
+44% → +5%valuation-model bias after back-testing & trust-gating
~79.6%coverage on calibrated 80% price-prediction intervals
Read the case study →
nidopr.app View live ↗
Pillar 2 · Live at licitapr.com

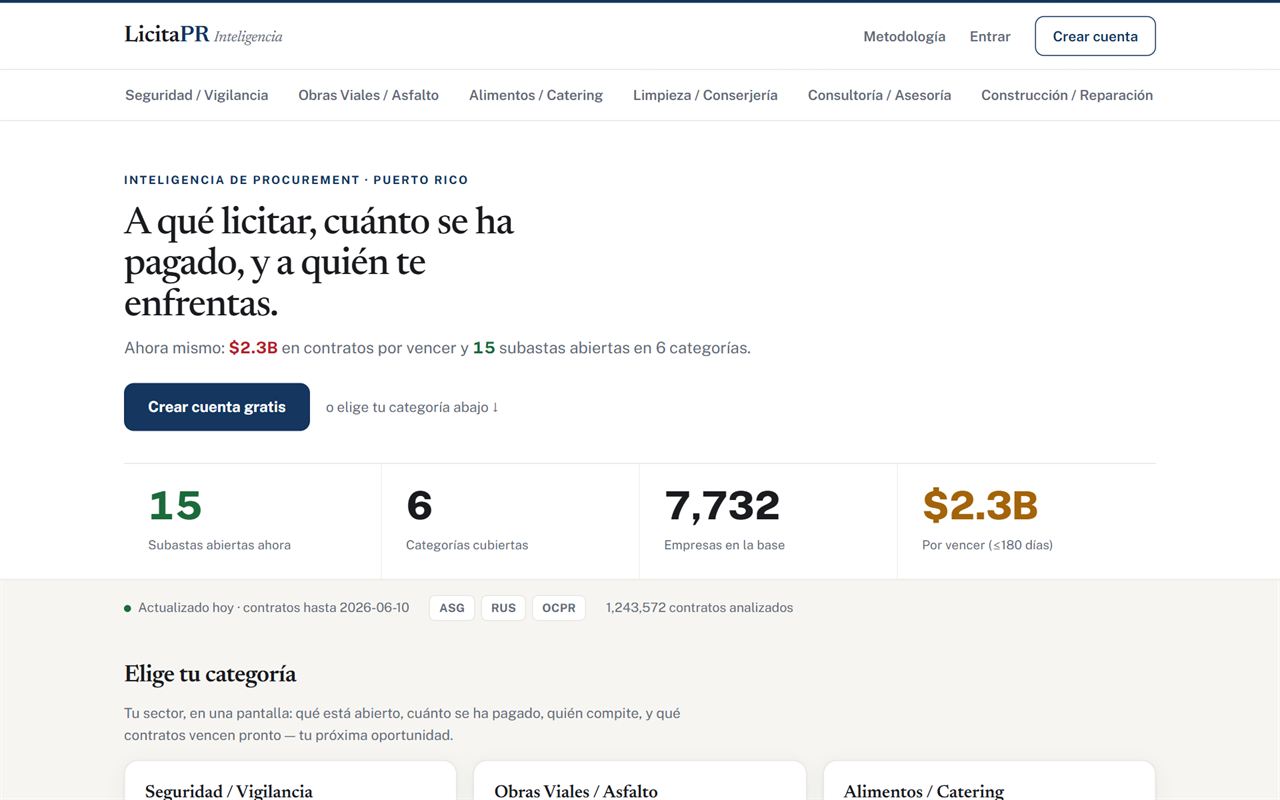
LicitaPR Inteligencia

Thirty-four government sources that don't talk to each other, unified into one procurement-intelligence product that looks ahead instead of back.

~1.37Mgovernment contracts ingested from 34 sources
422K → ~345Kvendors resolved to entities (Splink + deterministic)
6procurement categories in the live product
Read the case study →
licitapr.com View live ↗
Pillar 3 · Live at demo.streetos.app

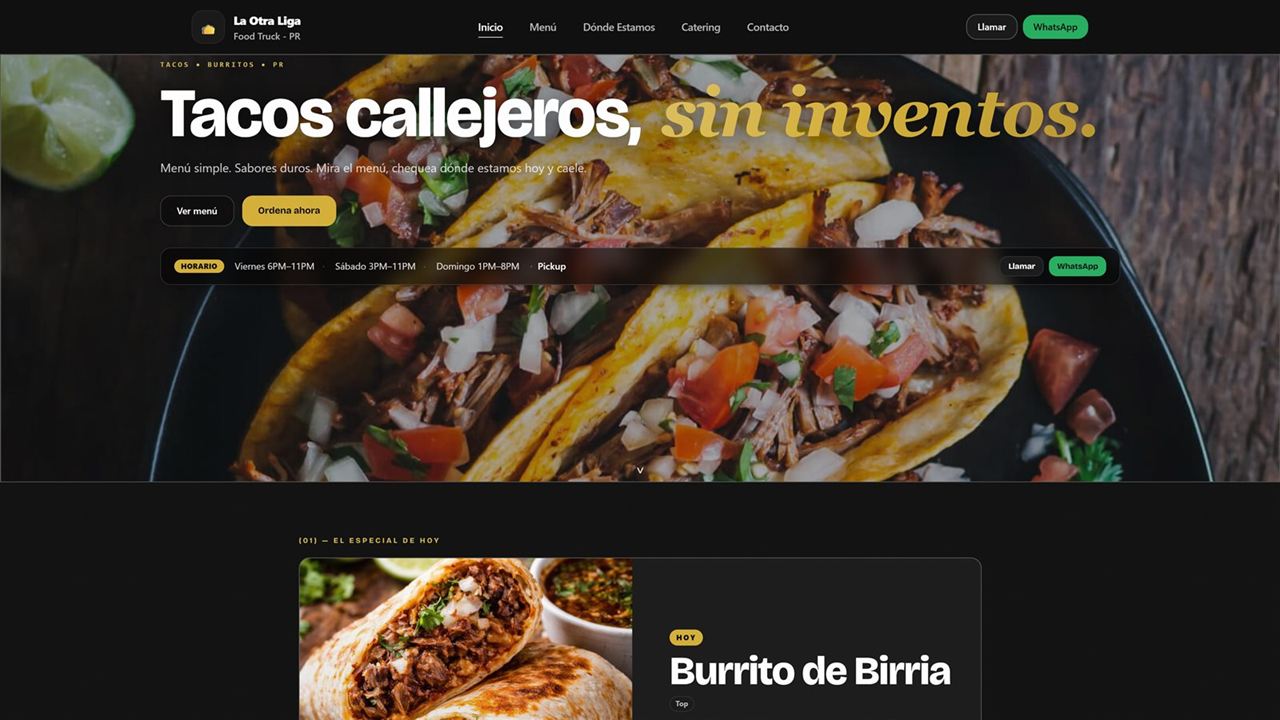
StreetOS

A multi-tenant operating system for food businesses: ordering, kitchen display, inventory, Puerto Rico sales tax by item class, and end-of-day close.

Multi-tenanteach tenant on its own isolated instance and subdomain
Tax by classPuerto Rico sales tax per item, with end-of-day close
No-codeowner-editable site builder, menu and pages
Read the case study →
demo.streetos.app
StreetOS preview
Live demo, open to anyone.

Curiosity · off the clock

What I build when no one’s paying me.

Same rigor, pointed at a question I just wanted answered. No client, no brief — curiosity run all the way to a live, defensible product.

Live · personal research

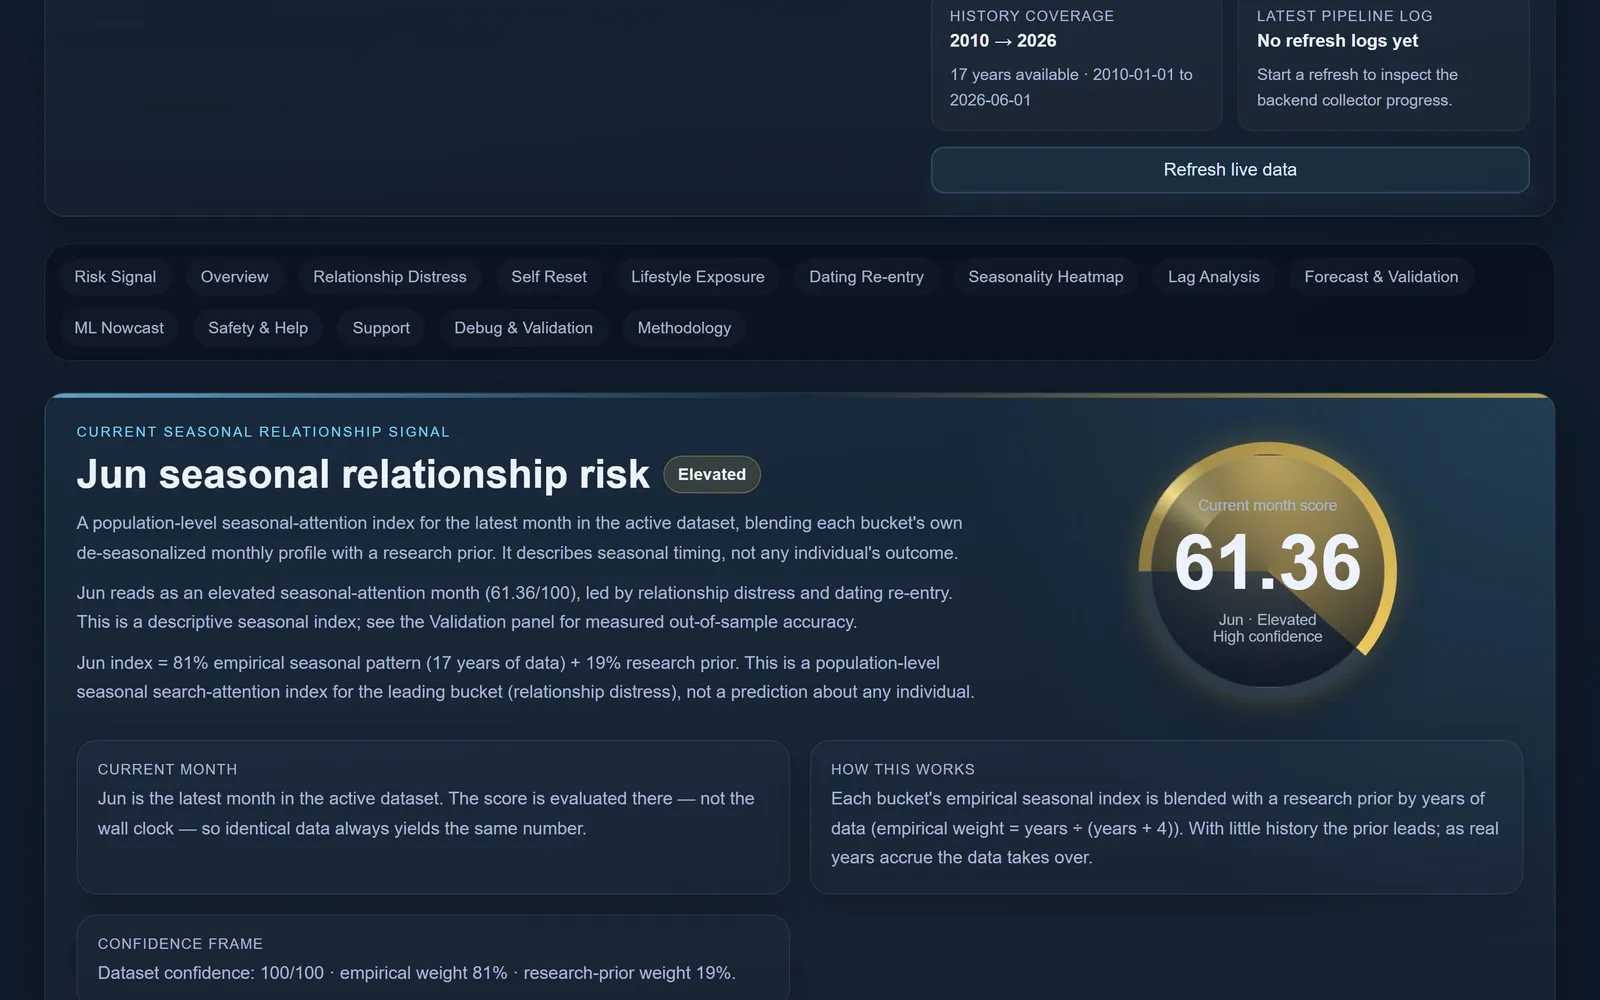
databro — reading heartbreak as a season

16 years of US search data, turned into a distress index that knows what it can't prove.

16 yrsof real US Google Trends, Jan 2010 – Jul 2026 (~9,900 monthly records)
4 / 4bucket next-month (t+1) forecasts that beat seasonal-naive AND survive Benjamini-Hochberg FDR (July 2026 refresh)
0.354strongest t+1 out-of-sample skill (reset, Diebold-Mariano p < 0.0001); distress 0.284 at p = 0.0036
Read the case study →
databro.vizlogic.tech View live ↗
Move the month, watch the gauge settle, run the forecast out, then read the caveats sitting right next to the charts.

Have data? Let’s make it think.

Available for consulting engagements through Vizlogic, and open to senior data, analytics and AI engineering roles — remote, U.S.